实验要求
- 调试并理解回归示例的源代码实现regression.py。掌握其中的datasets.make_regression函数和np.random.normal函数。并生成500个1维的回归数据,以及100个噪声点,作为数据集。
- 使用train_test_split函数将数据集划分为训练集和测试集(8:2),使用一元线性回归和一元二次多项式回归对数据进行拟合。
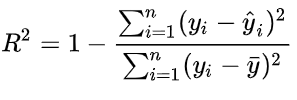
- 使用sklearn.metrics模块中的r2_score函数计算R方确定系数。
- 将测试样本和回归曲线进行可视化。
在测试集上分别测试一元线性回归和一元二次多项式回归,并使用sklearn.metrics的mean_squared_error函数计算预测值和实际值之间的平均平方误差MSE。
实验代码
引入库
import numpy as np
from matplotlib import pyplot as plt
from sklearn import linear_model, datasets
from sklearn.model_selection import train_test_split
from sklearn.preprocessing import PolynomialFeatures
from sklearn.metrics import r2_score, mean_squared_error
设置噪声和样本数
n_samples = 500 #样本数
n_outliers = 100 #噪声数
生成回归模型数据
# 构造数据集  sample为样本数 feature为X维度 informative为y维度  noise为数据之间的间隔,高斯噪声
# coef为系数  random_state是否随机,none的时候随机,参数相当于标记,使得标记相同的时候产生的数据一样
X, y, coef = datasets.make_regression(n_samples=n_samples, n_features=1,
                                   n_informative=1,bias = 0, noise=10,
                                   coef=True, random_state=0)
#x的shape(500,1)  y的shape(500,)
bias
bias:偏差(截距)
| bias | 0 | 150 | |
|---|---|---|---|
| 图片 | 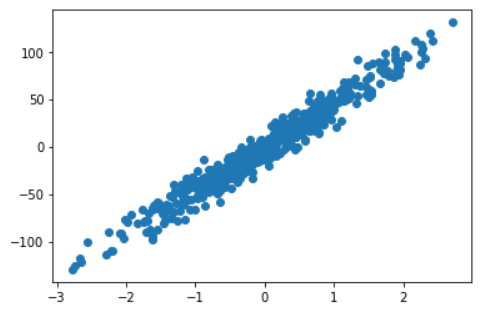 | 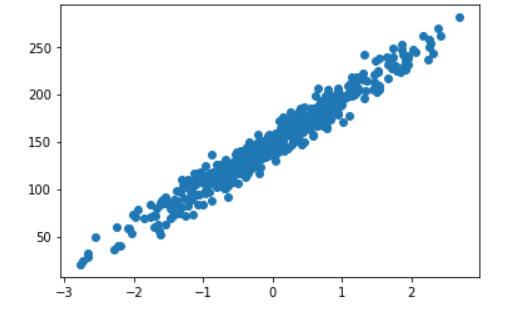 |
plt.scatter(X,y) #显示生成的回归模型
plt.show()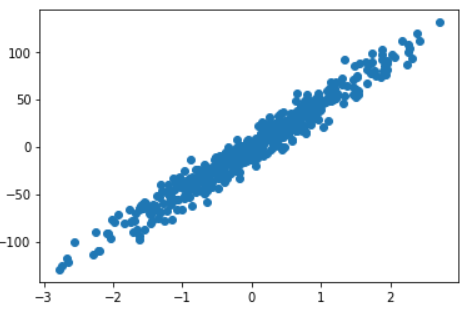
生成噪声点
np.random.seed(0) #随机数种子,参数表示随机数起始的位置,使得每次生成的噪声点位置一样,使得X,y的生成规律一样
X[:n_outliers] = 3 + 0.5 * np.random.normal(size=(n_outliers, 1)) #正态分布,size表示生成(n_outlier, 1)的数组
y[:n_outliers] = -3 + 10 * np.random.normal(size=n_outliers) #截取的是前100个数
#3+0.5是让数据点的横坐标以3为中心呈现正态分布,0.5取值是因为横坐标的差值小
plt.scatter(X,y) #显示生成添加了噪声的回归模型
plt.show()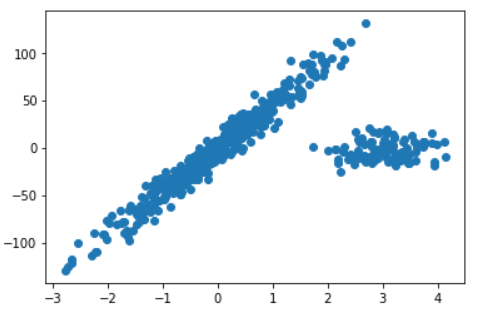
对样本进行划分
#train_test_split函数用于将矩阵随机划分为训练子集和测试子集,并返回划分好的训练集测试集样本和训练集测试集标签。
X_train, X_test, y_train, y_test = train_test_split(X,y,test_size=0.2,random_state=0)
#划分好训练集和测试集的样本
fig = plt.figure()
train = fig.add_subplot(121)
test = fig.add_subplot(122)
train.set_title('train')
train.scatter(X_train,y_train)
test.set_title('test')
test.scatter(X_test,y_test)
plt.show()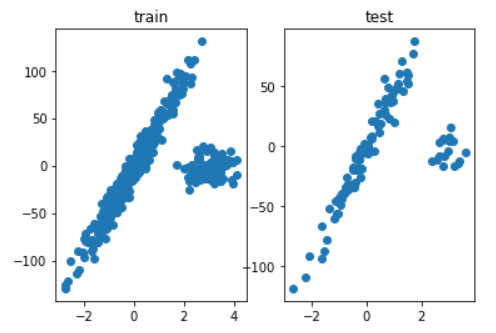
一元线性回归
lr = linear_model.LinearRegression()# 创建一个LinearRegression模型
lr.fit(X_train, y_train) #训练集上训练一个线性回归模型

line_X = np.arange(X_train.min(), X_train.max())[:, np.newaxis] #增加维度,见下方。作用是平均取点,使得直线更加的直
#一元线性训练集预测
line_trainy = lr.predict(line_X) #以LinearRegression的模型预测y
plt.scatter(X_train, y_train, color='gold', marker='.')
plt.plot(line_X, line_trainy, color='navy')
plt.xlabel("Input")
plt.ylabel("Response")
plt.show()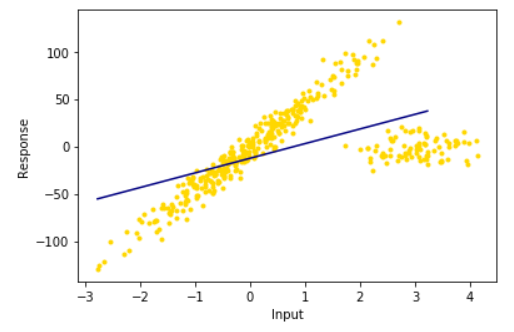

ransac = linear_model.RANSACRegressor( base_estimator = linear_model.LinearRegression(),#base_estimator 仅限于回归估计,默认LinearRegression
                                      min_samples = 10,residual_threshold = 25.0,stop_n_inliers = 320,#最小样本  残差  内集阈值
                                      max_trials = 100,random_state = 0)# 迭代次数
ransac.fit(X_train, y_train)
inlier_mask = ransac.inlier_mask_
outlier_mask = np.logical_not(inlier_mask)#自动识别划分内点集和外点集
line_y_train_ransac = ransac.predict(line_X)

plt.scatter(X_train[inlier_mask], y_train[inlier_mask], color='yellowgreen', marker='.')
plt.scatter(X_train[outlier_mask], y_train[outlier_mask], color='gold', marker='.')
plt.plot(line_X, line_y_train_ransac, color='cornflowerblue',label='RANSAC regressor')
plt.xlabel("Input")
plt.ylabel("Response")
plt.show()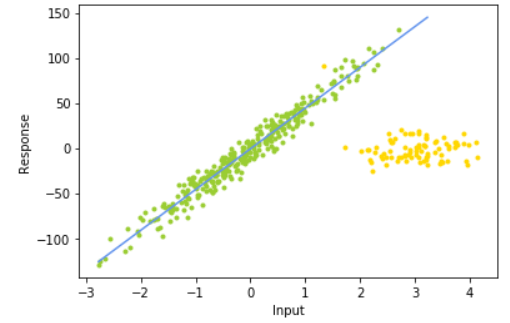
- 随机选择n个样本点(n是人为指定的模型所需最小样本点数量);
- 根据这些样本得出回归模型;
- 根据上一步得到的模型计算所有样本点的残差(residual),将残差小于预设残差阈值的点归为inlier,其余是outlier;(残差为真实值与预测值的差)
- 判断inlier数量是否达到预设的样本数阈值,如果达到则说明模型足够合理,如果未达到则重复上述步骤。
#初始化二次多项式生成器
poly2 = PolynomialFeatures(degree=2)#设置多项式阶数为2
X_train_poly2 = poly2.fit_transform(X_train)#用fit_transform将X_train变成2阶

#一元二次多项式回归
lr2 = linear_model.LinearRegression()
lr2.fit(X_train_poly2,y_train)

X_train_poly1=poly2.fit_transform(line_X)
#一元二次多项式训练集预测
line2_trainy = lr2.predict(X_train_poly1)

plt.scatter(X_train, y_train, color='gold', marker='.')
plt.plot(line_X, line2_trainy, color='navy')

plt.show()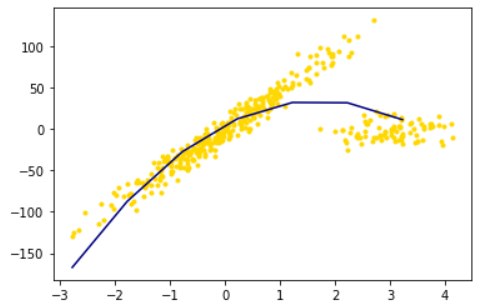
plt.scatter(X_train[inlier_mask], y_train[inlier_mask], color='yellowgreen', marker='.',label='Inliers')
plt.scatter(X_train[outlier_mask], y_train[outlier_mask], color='gold', marker='.',label='Outliers')
plt.plot(line_X, line_trainy, color='navy',label='Line_degree1')
plt.plot(line_X, line_y_train_ransac, color='cornflowerblue',label='RANSAC regressor')
plt.plot(line_X, line2_trainy, color='red',label='Line_degree2')
plt.legend(loc='lower right')
plt.xlabel("Input")
plt.ylabel("Response")
plt.show()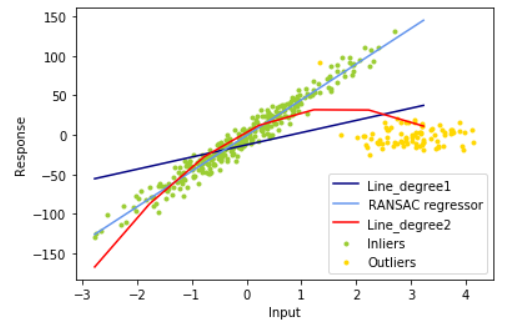
line1 = lr.predict(X_train)
line_ransac = ransac.predict(X_train)
line2 = lr2.predict(X_train_poly2)
#利用sklearn.metrics模块中的r2_score函数计算R方确定系数
print("LinearRegression之一元线性train的R方系数:")
print(r2_score(y_train,line1))
print("RANSACRegressor之一元线性train的R方系数:")
print(r2_score(y_train,line_ransac))
print("LinearRegression之一元二次多项式train的R方系数:")
print(r2_score(y_train,line2))


#利用sklearn.metrics模块中的mean_squared_error函数计算均方误差 真实值与预测值之间的差的平方求平均
print("LinearRegression之一元线性train的MSE:")
print(mean_squared_error(y_train,line1))
print("RANSACRegressor之一元线性train的MSE:")
print(mean_squared_error(y_train,line_ransac))
print("LinearRegression之一元二次多项式train的MSE:")
print(mean_squared_error(y_train,line2))| 回归模型 | R方系数 | 均方误差 | |
|---|---|---|---|
| LinearRegression之一元线性 | 0.3353684383362009 | 1175.5447139156627 | |
| RANSACRegressor之一元线性 | -1.3671578023822781 | 4186.830722616691 | |
| LinearRegression之一元二次多项式 | 0.7334945258284558 | 471.3725911656628 |


One comment
[...]代码参考:https://www.ndmiao.cn/index.php/archives/99/[...]